Skip to content
PhoenixCrypto

Local map · Phoenix metro

Phoenix crypto access, area by area

Kiosk placement follows retail leases, not rooftops — which is why Maryvale is saturated and Arcadia is nearly empty despite having far more money in it. Ten areas, honest density bands, the host types you'll find, and the four gaps nobody has filled.

Licensed US platform

CEX.IO Corp · FinCEN-registered MSB · NMLS ID 1804170 · check the register

Areas covered
10
City kiosks
95–160
Densest area
Maryvale
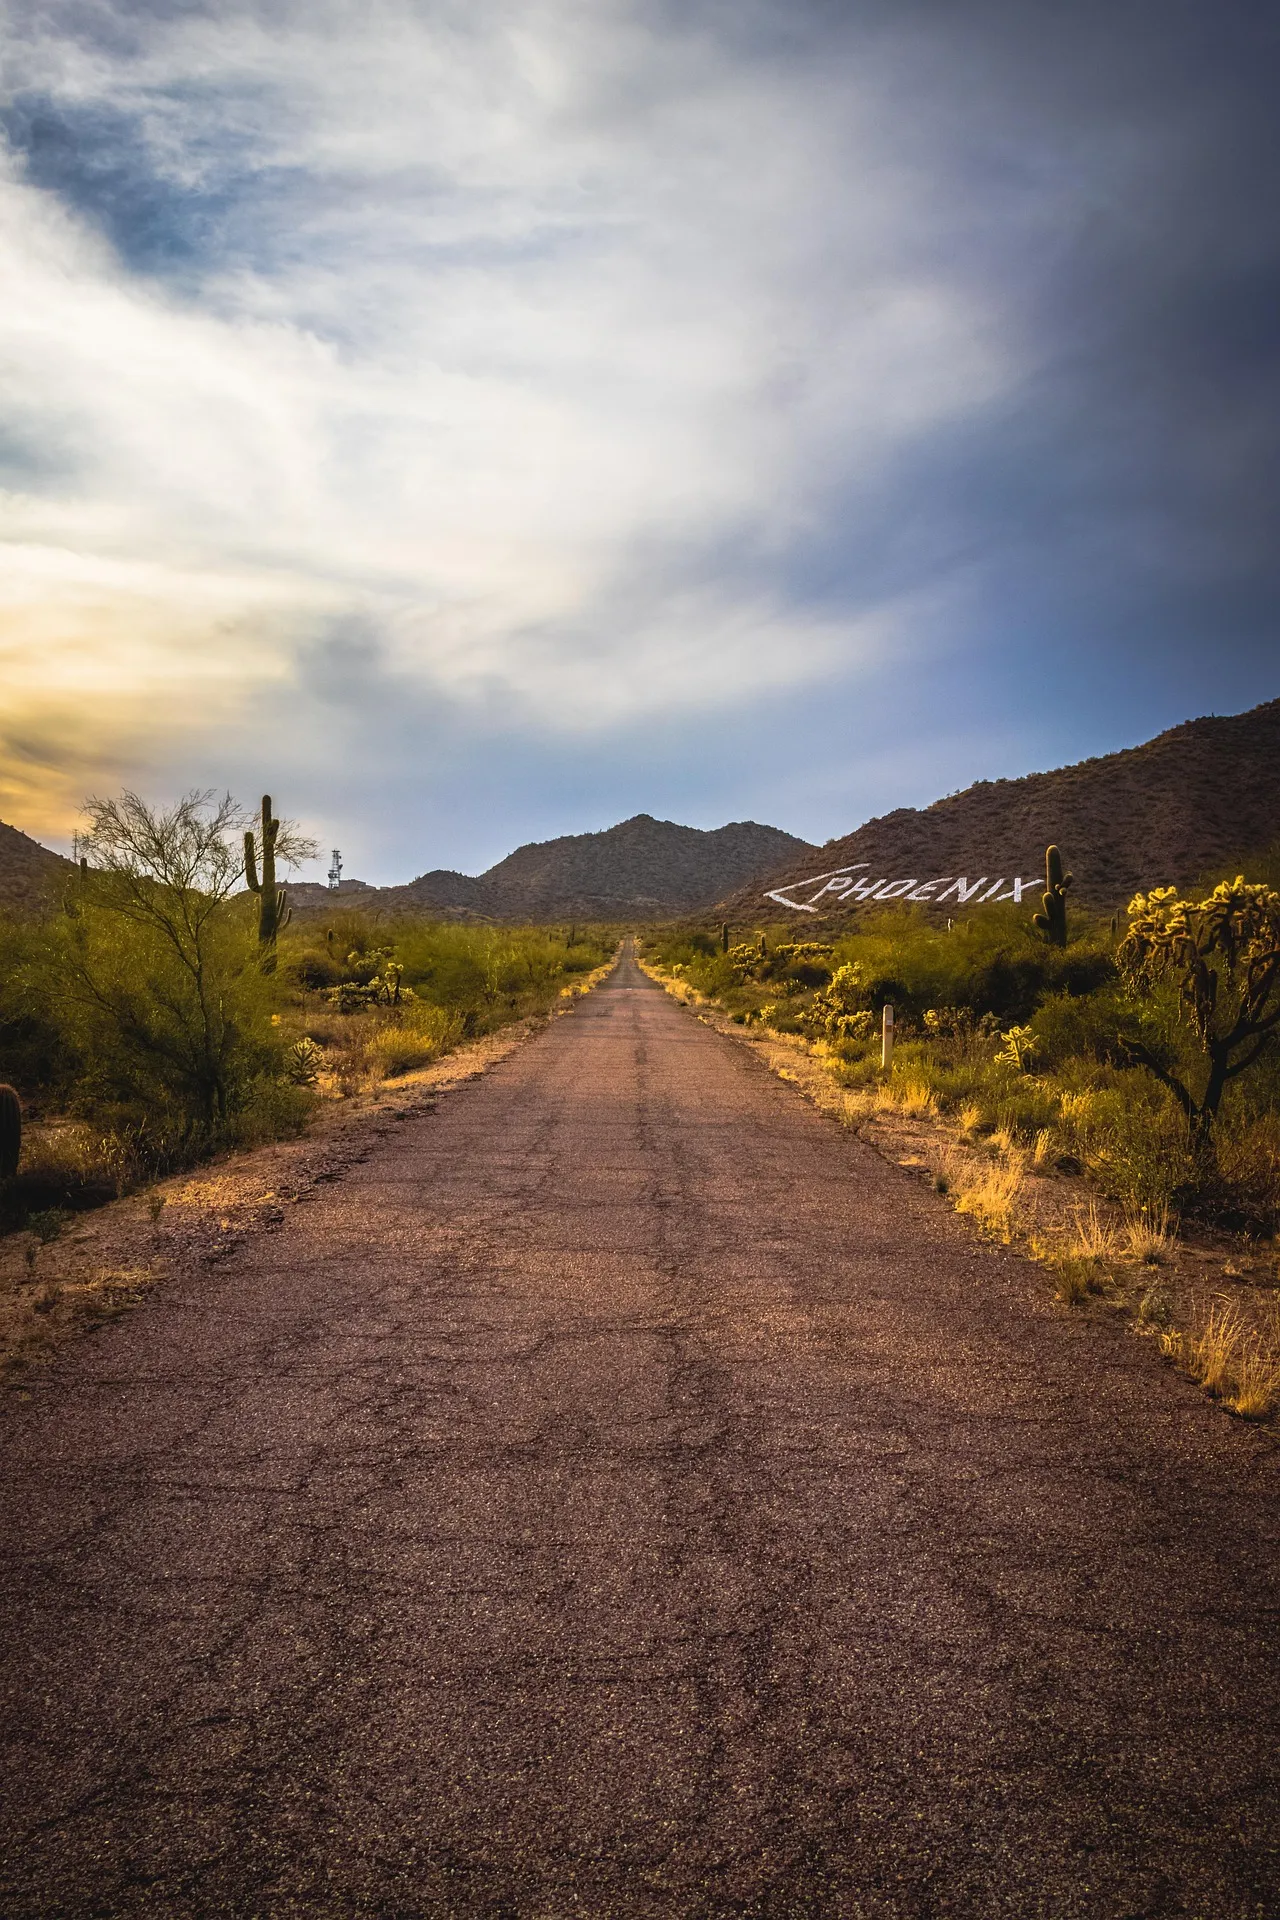
A desert road leading toward the Phoenix mountain sign outside the city at sunset

Why the machines sit where they sit

Once you understand the business, the map stops looking random. A crypto kiosk operator is running a retail-leasing operation, and it needs four things from a location: long opening hours, a cash-comfortable customer base, rent that is low per square foot, and a store owner willing to take a revenue share for a few feet of floor.

In Phoenix that specification describes independent gas stations, neighborhood markets, liquor stores and smoke shops almost perfectly. It describes a bank branch not at all, an office lobby not at all, and a supermarket in a master-planned community only occasionally. Which is why the density map tracks commercial arterials rather than population, and why the wealthiest parts of the Valley have the fewest machines.

The second thing shaping the map is that Phoenix is enormously spread out. This is a low-density city organised around a mile grid and a handful of freeways, so "nearby" here can mean a fifteen-minute drive in a way it would not in a dense East Coast metro. Coverage that looks reasonable on a citywide count can still leave individual neighborhoods genuinely far from a machine — particularly a two-way one.

What follows is how that plays out area by area. Density bands are our reading of published tracker data and operator locators rather than a precise count, because the counts move weekly and any single number would be stale by the time you read it.

Ten areas, area by area

01

Downtown Phoenix

Medium kiosk density

The area

Offices, the convention corridor, ASU's downtown campus and stadium traffic. Demand is bursty and event-driven rather than steady.

Typical hosts

Convenience stores on Central and Van Buren, a handful of parking-adjacent retail sites

What's missing

Two-way machines are scarce given how many visitors want to cash out, not load up.

02

Midtown & Central Corridor

Medium kiosk density

The area

The Central Avenue office spine plus dense apartment stock. A commuter market that transacts on the way home.

Typical hosts

Gas stations along Central, 7th Street and 7th Avenue

What's missing

Fees vary wildly between machines two blocks apart, which is where most money is lost here.

03

Maryvale & West Phoenix

High kiosk density

The area

The densest kiosk cluster in the city. Large Hispanic and Latino population, high share of cash-preferring and remittance-sending households.

Typical hosts

Neighborhood markets, liquor stores, independent gas stations along Indian School and Grand Avenue

What's missing

Plenty of buy capacity, far less sell capacity — the mismatch is the clearest gap in the city.

04

South Phoenix

Medium kiosk density

The area

Historically underbanked stretches along Baseline and Central south of the river, with rapid new development pressure.

Typical hosts

Convenience stores, smaller independent grocers

What's missing

Thin coverage relative to population; several ZIPs need a long drive to reach a two-way machine.

05

North Phoenix & Deer Valley

High kiosk density

The area

Sprawling retail along the I-17 and Loop 101 corridors. Machines follow the shopping centers, not the rooftops.

Typical hosts

Big-box adjacent convenience retail, gas stations at freeway interchanges

What's missing

Well supplied on the arterials, poorly supplied inside residential pockets.

06

Arcadia & Camelback East

Low kiosk density

The area

Higher-income, high-homeownership area. Residents here overwhelmingly use exchanges and brokerages, not kiosks.

Typical hosts

A few sites near the Camelback and 44th Street retail nodes

What's missing

Not really a gap — kiosk demand is genuinely low. Advisory and OTC demand is the real opportunity.

07

Scottsdale

Medium kiosk density

The area

Wealth-management and family-office concentration, plus a tourist and nightlife economy in Old Town.

Typical hosts

Convenience retail on Scottsdale Road and near Old Town

What's missing

Machine count sits below what local income would predict; the market here is OTC and private-client, not cash.

08

Tempe

Medium kiosk density

The area

ASU drives a young, mobile, app-first user base with small ticket sizes and high transaction frequency.

Typical hosts

Convenience stores around campus and along Apache Boulevard

What's missing

Small-ticket buyers pay the highest effective percentage — this is the group kiosk pricing punishes most.

09

Mesa

High kiosk density

The area

The metro's second-largest fleet, spread across a wide, low-density street grid.

Typical hosts

Gas stations, grocery and liquor retail along Main Street and Country Club

What's missing

Coverage is broad but uneven in quality; machine uptime is a real variable.

10

Glendale & Chandler

Medium kiosk density

The area

Glendale's traffic spikes around the sports and entertainment district. Chandler skews to tech-employed households who default to exchanges.

Typical hosts

Convenience and grocery retail on the main arterials

What's missing

Published counts are unstable, so verify on an operator's own locator before travelling.

City vs metro

Don't mix the city figure with the metro figure

This is where most published numbers go wrong. Phoenix city proper and the Phoenix metropolitan area are very different denominators, and quoting one as the other inflates the picture considerably.

Cryptocurrency kiosk counts across Phoenix city proper and surrounding metropolitan cities
CityMachinesNotes
Phoenix95–160City proper; the spread is a tracker-refresh artefact
Mesa~68Second-densest fleet in the metro
Scottsdale~31Thinner than income levels would suggest
Tempe~30Student-heavy demand around ASU
GlendaleTracker-dependentCounts move week to week
ChandlerTracker-dependentNo stable published figure

Counts from public kiosk trackers at the time of review and change weekly. The Phoenix metropolitan statistical area recorded a population of 4,845,832 at the 2020 Census, against a city population well under half that — always check which figure a source is quoting.

The four real market gaps

Not a wish list — these are the places where the mismatch between demand and provision is structural, and where a new entrant would actually find customers.

Sell capacity, almost everywhere. This is the big one. Two-way machines are a minority of the Phoenix fleet, and the imbalance is worst precisely where buy capacity is highest — West and South Phoenix. A household that acquired crypto at a kiosk on Indian School Road may have no reasonable way to reverse the trip locally. See the cash-out page for what to do about it in the meantime.

South Phoenix generally. Coverage here is thin relative to population, in an area with historically underbanked stretches along Baseline Road and Central south of the river, and rapid new development pressure. On the metrics that predict kiosk demand — cash usage, banking access, retail density — South Phoenix should support more machines than it has.

Residential North Phoenix. The arterials and freeway interchanges are well served; the neighborhoods behind them are not. In a city where a mile grid means a mile is a drive, that distinction matters more than a citywide count suggests.

Scottsdale's advisory demand. The most interesting gap, and the one least likely to be filled by a kiosk. Wealth is concentrated in Scottsdale and Paradise Valley, the machine count is below what income would predict, and the actual demand is for private-client execution, custody structuring and integrated tax and estate advice. Much of it is currently served from out of state — we cover the shape of that market on the OTC page.

Cash, remittances and West Phoenix

The densest kiosk cluster in Phoenix is not an accident of geography and it is worth understanding properly rather than glossing over.

Maryvale and the wider West Phoenix corridor have a large Hispanic and Latino population, a high share of cash-preferring and underbanked households, and an established retail infrastructure of neighborhood markets, cheque-cashing storefronts and independent gas stations. That is the exact profile a kiosk operator looks for, and the industry located itself accordingly — largely where the banking system did not.

The remittance dimension is real too. Sending value across a border has traditionally meant a money-transfer window and a fee measured in percentage points, and crypto rails are genuinely competitive on that comparison in a way they are not for domestic payments. Which is why the same corridor also supports staffed cash-to-crypto counters — Coinme lists roughly forty retail partner locations across Phoenix, predominantly at CVS, and those are frequently cheaper and more comfortable than the machine next door. Detail on the cash page.

The uncomfortable half of the same story: this is also the corridor where kiosk pricing does the most damage, because the households paying a fifteen-percent premium are the ones least able to absorb it, and because fee variation between adjacent machines is completely invisible from the street.

If you're in a high-density area, the comparison is free

Where machines are clustered, you have leverage nobody uses. Arizona caps daily amounts but not fees, and pricing is set per machine — so in Maryvale, West Phoenix or along the I-17, checking two or three nearby units on their operators' own locators before you leave the house routinely finds a double-digit percentage difference on the same transaction.

Visitors, Old Town and Sky Harbor

Phoenix and Scottsdale take a serious volume of visitors — spring training, golf, conventions, Old Town nightlife — and the crypto behaviour of visitors is different from residents in one specific way: they are more likely to want to convert out than in.

Which makes the shortage of two-way machines around Downtown Phoenix and Old Town Scottsdale a genuine mismatch rather than an academic observation. A visitor holding crypto and wanting dollars for the weekend has fewer options in the areas built for visitors than in the residential corridors they will never see.

The practical answer for anyone in that position is not a kiosk at all. A crypto card spends anywhere and pulls cash from any ordinary bank ATM at a fraction of kiosk pricing, which is a far better tool for a trip. And for spending directly, the handful of Valley merchants that accept crypto are covered on the paying-with-crypto page.

Finding a machine near you, properly

Three rules, and they will save you a wasted drive in a Phoenix August.

Use the operator's own locator, not an aggregator. Third-party maps are useful for seeing the shape of the market and unreliable for whether a specific unit is online, stocked and currently operating. Only the operator knows that. Our kiosk finder links directly to each operator's page for exactly this reason.

Check the hours, not just the address. Roughly forty percent of Phoenix machines run around the clock, which means the majority do not — they run on convenience-store hours, and a location that is technically 24/7 can still be behind a locked door at 2am.

Call ahead if you are selling. Arizona now requires operators to staff a live toll-free line continuously. Ask whether that specific machine is two-way and whether it currently holds enough cash for your amount. Cassette availability, not capability, is the usual reason a sell attempt fails.
From the deskPhoenix Crypto research desk

The map that would actually help doesn't exist yet

Every public kiosk map shows you locations. None of them show you price. Given that Arizona sets no fee cap and pricing is set per machine, the genuinely useful overlay for a Phoenix resident would be a heat map of all-in cost — and it is the one piece of information the industry has no incentive to publish.

Until somebody builds it, the manual version is two minutes of checking before you leave. In the densest parts of the city that is the difference between paying eight percent and paying eighteen for an identical transaction on the same street.

FAQ

Phoenix area coverage — questions

Which Phoenix neighborhood has the most Bitcoin ATMs?

Maryvale and West Phoenix hold the densest cluster in the city, concentrated in neighborhood markets, liquor stores and independent gas stations along Indian School Road and Grand Avenue. North Phoenix and Deer Valley are also well covered, though almost entirely at the I-17 and Loop 101 interchanges rather than inside residential areas.

Are there crypto ATMs in Downtown Phoenix?

Yes, a moderate number, concentrated in convenience retail along Central Avenue and Van Buren Street. Demand downtown is event-driven — conventions, stadium traffic, the ASU downtown campus — which makes it bursty rather than steady. Notably, two-way machines that pay out cash are scarce here relative to how many visitors want to sell rather than buy.

How many Bitcoin ATMs are in Scottsdale, Tempe and Mesa?

Public trackers put Mesa at roughly 68 machines, making it the second-densest city in the metro, with Scottsdale near 31 and Tempe near 30. Glendale and Chandler counts move week to week and no stable published figure exists — verify on an operator's own locator before travelling.

Why does Scottsdale have fewer crypto ATMs than its income would suggest?

Because kiosks are the wrong product for that market. Scottsdale households overwhelmingly access crypto through exchanges and brokerages, and the genuine local demand is for private-client execution and integrated advice rather than cash conversion. The area's density of wealth managers, family offices and estate attorneys is where that demand is actually served.

Which Phoenix areas are underserved for crypto?

Four stand out. South Phoenix has thin coverage relative to population, with several ZIPs a long drive from any two-way machine. Residential pockets across North Phoenix are poorly served despite strong arterial coverage. Two-way sell capacity is scarce almost everywhere, most acutely in West and South Phoenix. And Scottsdale's advisory demand is largely met from out of state.

Are Bitcoin ATM fees different in different parts of Phoenix?

Yes, and materially. Arizona sets no statutory cap on kiosk fees and pricing is set machine by machine, so two units from different operators a few hundred yards apart on the same arterial road can differ by a double-digit percentage on the same transaction. Checking two or three nearby machines before travelling is the single highest-return habit in this market.